How to Measure Influencer Marketing ROI (Formula, KPIs and a Free Tracker)
·15 min read·By Abubakr Chan
Influencer marketing ROI is (gross profit from attributed sales minus total cost) divided by total cost, where total cost includes creator fees, product at cost, shipping and the hours your team spent. A campaign is profitable when that number is above zero inside your attribution window; how far above zero counts as good depends on what the same money earns in your other channels. To get a number you can defend, track three things per creator: whether and when they posted, the sales tied to their code or link, and every cost, including the hours nobody writes down.
This guide gives the formula with a worked example, a KPI table by campaign goal, the six attribution methods and what each one misses, and a free tracker spreadsheet that does the arithmetic. Disclosure: we make Cheerful, an influencer marketing platform that detects creator posts and ties Shopify discount-code sales to each creator. It does not calculate ROI for you, and the method below works with a spreadsheet alone.
Free influencer marketing ROI trackerExcel / Google Sheets (.xlsx) · free, no email requiredCreators, Posts, Codes & links, Costs, ROI and Report tabs. Every total is a live formula; import it into Google Sheets and it keeps working.How do you measure influencer marketing ROI? The six steps
- 1Pick one goal per campaign and the KPI that proves it (the table below). Sales, reach and content are different campaigns with different scorecards.
- 2Set up attribution before anything ships: a unique discount code and a tagged link per creator, written into the brief.
- 3Capture every post, including untagged ones and Stories, with its views and engagement. You cannot credit a post you never saw.
- 4Record every cost per creator: fee, product at cost, shipping, and team hours at an hourly rate.
- 5Calculate profit ROI, ROAS and cost per result per creator, inside a fixed attribution window.
- 6Report the sales line and the content line separately, and write down what the method cannot see.
The rest of this page takes those steps in order. If your campaign is pure gifting with no fees, the gifting ROI guide covers the same method with a gifting-specific report.
What is the influencer marketing ROI formula?
Use profit ROI: (gross profit from attributed sales minus total cost) divided by total cost, times 100. Two other numbers get called ROI and both flatter the campaign. ROAS (return on ad spend) is revenue divided by cost, and revenue ROI is (revenue minus cost) divided by cost. Neither subtracts what the product cost you to make, so a campaign can post a healthy ROAS and still lose money.
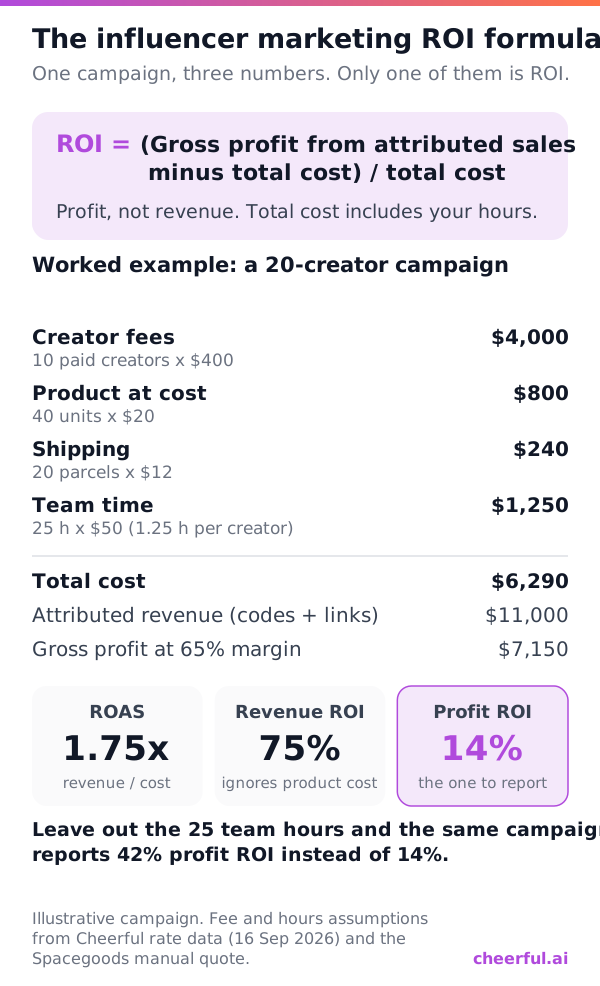
The worked example is an illustrative 20-creator campaign: 10 paid creators in the 10K to 50K follower band and 10 gifted ones. The $400 fee is a realistic midpoint for that band, between the median brand offer ($200) and the median creator first ask ($500) in the negotiations we measured on Cheerful in September 2026. The 1.25 hours per creator comes from a real quote: Spacegoods was told a 400-creator campaign would take a dedicated person three months, about 520 hours.
| Line | Calculation | Amount |
|---|---|---|
| Creator fees | 10 paid creators x $400 | $4,000 |
| Product at cost | 40 units x $20 cost of goods (not retail price) | $800 |
| Shipping | 20 parcels x $12 | $240 |
| Team time | 20 creators x 1.25 h x $50 an hour | $1,250 |
| Total cost | $6,290 | |
| Attributed revenue | Code and link sales, net of discounts and refunds, 30-day window | $11,000 |
| Gross profit | $11,000 x 65% gross margin | $7,150 |
| ROAS | $11,000 / $6,290 | 1.75x |
| Revenue ROI | ($11,000 - $6,290) / $6,290 | 75% |
| Profit ROI | ($7,150 - $6,290) / $6,290 | 14% |
Two things to notice. The same campaign reads 75% or 14% depending on whether you subtract product cost, so always say which one you are reporting. And if you leave out the 25 team hours, profit ROI jumps to 42%. That gap is why the hours line matters more than most reports admit.
What is a good ROI for influencer marketing?
A good ROI is any profit ROI above zero that beats what the same budget earns in your next-best channel, measured the same way. There is no universal target, because margins differ: a brand with 80% gross margin can profit at a ROAS that would sink a brand at 30%. Work out your break-even ROAS first. It is 1 divided by your gross margin, so 1.54x at 65% margin and 3.33x at 30%. Anything under that line loses money on the sales measured, whatever it does for awareness.
What about the $5.20 or $5.78 per $1 spent that AI answers quote? It comes from Influencer Marketing Hub’s 2020 benchmark report: a self-reported survey of about 4,000 marketers and agencies, and it measured earned media value (EMV) per dollar, not revenue or profit. The report does not say how respondents calculated EMV. It is a 2018 and 2019 figure about perceived media value, and it is not a benchmark for your sales ROI.
A real campaign looks different. AG1 ran its affiliate recruiting on Cheerful: 20,521 creators contacted, about 12% replied, and 2,030 opted in over roughly seven weeks. The case study reports a 24x projected ROI, $36k of value on about $1.5k of spend. The word that matters is projected: the value is what the opted-in affiliates were expected to generate, and the campaign was still running. Label your own numbers the same way. A projection is useful, but it is not the same thing as measured revenue.
Which influencer marketing KPIs should you track?
Track the KPI that matches the campaign’s goal, plus the cost per result. A reach campaign judged on sales looks like a failure, and a sales campaign judged on likes looks like a success it may not be. One goal per campaign keeps the report honest.
| Goal | Primary KPI | Cost metric | Where the number comes from | Watch out for |
|---|---|---|---|---|
| Awareness | Views or reach per post | CPM (cost per 1,000 views) | Post tracking; creator insight screenshots for reach | Follower count is not reach; Story views are often estimates |
| Engagement | Engagement rate per view; saves and shares | CPE (cost per engagement) | Post metrics | Compare to the creator’s own band, not a global average |
| Traffic | Link clicks and sessions | Cost per click or session | UTM links in your analytics | Only counts people who tap the tracked link |
| Sales | Attributed net revenue and orders | Profit ROI, cost per new customer | Discount codes and links in Shopify | Coupon-site leaks inflate codes; halo sales are missing |
| Content | Usable assets with usage rights | Cost per usable asset | Your content library and contracts | No rights, no asset: check the contract |
| Recruiting (affiliates, ambassadors) | Opt-in rate | Cost per opt-in | Your outreach log | Opt-ins are not sales yet; track them into revenue |
For engagement, benchmark by follower band, because the median falls with size. Across 5,924 Instagram accounts we measured, median engagement was 2.6% for 1K to 10K followers, 1.61% for 10K to 50K and 0.94% for 100K to 500K (benchmarks). A 1.5% post from a 300K account is above its band; the same rate from a 5K account is below it. The engagement rate calculator places a single creator against those bands.
If you only report five KPIs, make them: posts published as a share of creators shipped (post rate), views, attributed net revenue, profit ROI and cost per new customer. Those five answer whether it happened, whether anyone saw it, whether it sold, whether it paid, and whether it beat your other channels.
How do you track influencer marketing?
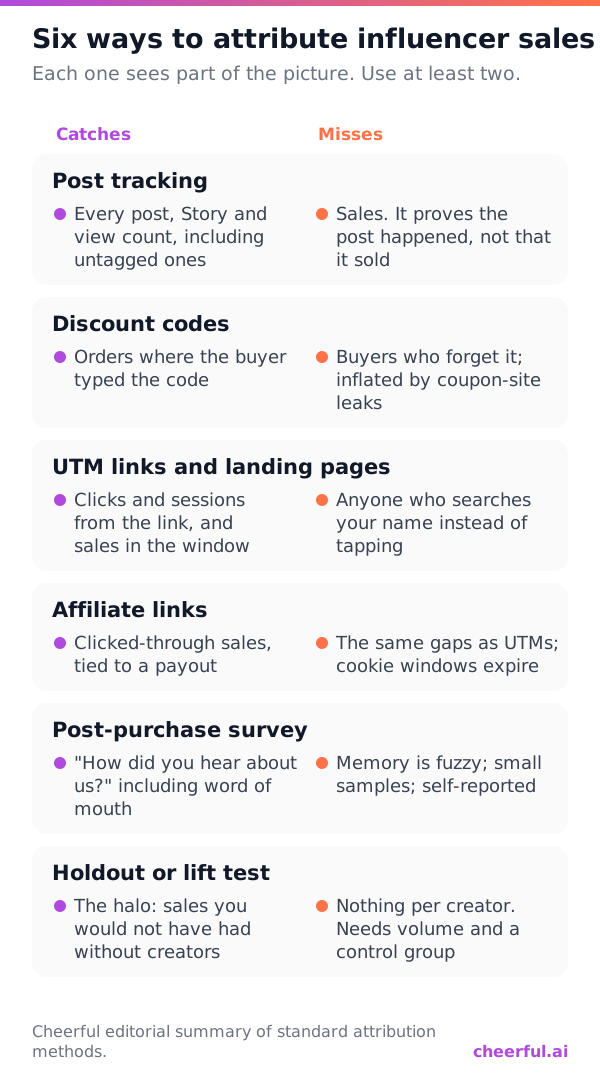
Track in two layers: capture every post first, then attribute sales with at least two methods, because every method misses something. Codes miss buyers who forget them; links miss people who search your name; neither sees word of mouth. The diagram shows what each method catches and misses, and the sections below say when to use each.
Step 0: know when they posted (post tracking)
Creators post days or weeks after the product lands, often without tagging you, and Instagram Stories disappear after 24 hours. If nobody sees the post, its views never reach your report and its sales look like organic. So the first job of influencer tracking is capture: every post from every campaign creator, with its date, format, views and engagement. By hand that means checking each profile every day; past about ten creators it stops happening. (More on this in how to know if an influencer actually posted.)
This is the step Cheerful automates. It checks campaign creators’ Instagram, TikTok and YouTube feeds daily and Instagram Stories every 12 hours, logs each post with its metrics, and shows an estimated EMV per post. In AG1’s program that capture logged 1.1M+ Instagram views across 126 creator accounts.

Promo codes
A unique discount code per creator is the most reliable sales signal for a small brand, because the revenue reads straight out of your store with no tracking setup. Make codes memorable (the creator’s name plus a number), give each creator exactly one, and put it in the brief so it appears on screen and in the caption. Two caveats: codes leak to coupon sites, so a spike from a creator who has not posted is a leak, not a win; and buyers who forget the code are lost.
Cheerful creates a code per creator in Shopify or GoAffPro and ties each order that uses it back to that creator (Shopify integration). Spacegoods’ 474-creator campaign got 89 codes that way. When one order carries two different creators’ codes, it credits neither creator rather than guessing, so the per-creator revenue errs low rather than high.
UTM links and landing pages
A UTM-tagged link per creator (utm_source=instagram, utm_campaign=spring_seed, utm_content=creatorname) shows clicks, sessions and sales within your analytics tool’s attribution window. Links suit YouTube descriptions, TikTok and Instagram bio links, and Story link stickers; they do little for a Reel with no clickable link. A dedicated landing page per creator, or per campaign, also catches people who type the URL they heard. Put the link and the code in the same brief and count each order once: when both fire on one sale, keep the code.
Affiliate links
An affiliate link is a tracked link tied to a commission, so attribution and payment are the same record. It has the same blind spots as UTMs, plus a cookie window that expires. Use it when creators are paid on commission; for flat-fee deals a UTM and a code are simpler. The commission belongs in the cost line, and so does any flat fee paid on top of it.
Measuring what codes miss: surveys, holdouts and lift
Codes and links undercount. People see a creator, search your brand a week later and buy at full price. Three ways to size that halo:
- A post-purchase survey: one question at checkout, “How did you hear about us?”, with creators as an option. Cheap and immediate, but self-reported and fuzzy about which creator.
- A holdout or geo test: run creators in some regions or weeks and not others, then compare total sales. It measures the incremental lift, but only at campaign level and only with enough volume to separate signal from noise.
- A branded-search check: compare branded search volume in the two weeks after a burst of posts with the two weeks before. It is directional, and it is free.
Report the halo as its own line with its method. Do not fold a survey estimate into the attributed revenue that drives your ROI, or the next campaign has no clean baseline.
What costs belong in influencer ROI?
All of them: creator fees and commissions, product at cost of goods (not retail price), shipping and packaging, paid boosts of creator posts, software used for the campaign, agency fees, and team hours at a loaded hourly rate. The hours are the line most reports skip, and for campaigns with many small creators they are often the largest line.
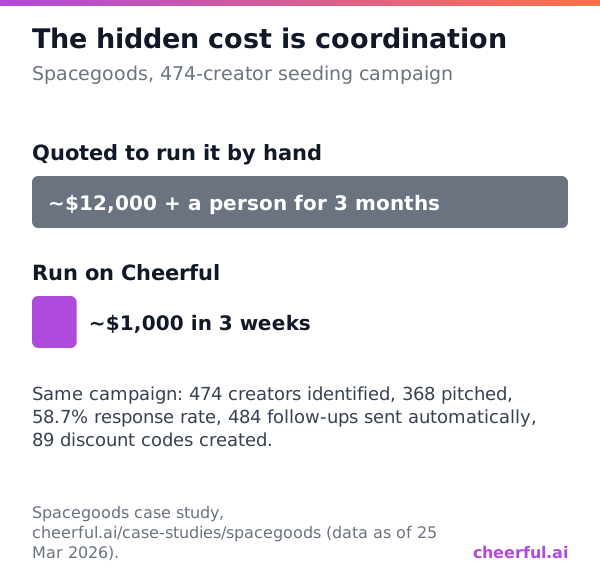
Spacegoods’ numbers show how big that line gets. Running a 474-creator seeding campaign by hand was quoted at roughly $12,000 and a dedicated team member for three months, for 852 personalized emails and 374 multi-step conversation threads. The same campaign ran on Cheerful in three weeks for about $1,000: 368 creators pitched, a 58.7% response rate and 484 follow-ups sent automatically (case study). Whichever way you run it, the coordination cost goes in the ROI denominator. The gifting ROI guide breaks down the same cost side for gifting-only campaigns.
Are EMV and earned media value a good measure of ROI?
No. EMV estimates what the same reach or engagement would have cost as paid media. It is not revenue, and adding it to sales in the ROI numerator counts the same post twice. There is also no single industry-standard EMV formula, so two tools can price the same post very differently.
Cheerful shows EMV per post too, so here is exactly how it is calculated. A feed post, Reel or TikTok is priced at $8 per 1,000 views plus $0.10 per like, $0.25 per comment and $0.50 per share. A Reel with 40,000 views, 2,000 likes, 80 comments and 60 shares therefore shows $570. Instagram does not expose Story views to outside tools, so a Story is estimated at 7% of the creator’s followers, priced at $5 per 1,000 views. Those constants are rough defaults, and the Story figure is an estimate by construction.
The useful version of EMV is your own: price views at the CPM you actually pay for paid social. The tracker does that from one input. Report it beside ROI as “content value”, never inside it. It answers a real question: what would this reach and creative have cost to buy? It just does not answer whether the campaign made money.
Free influencer tracking spreadsheet
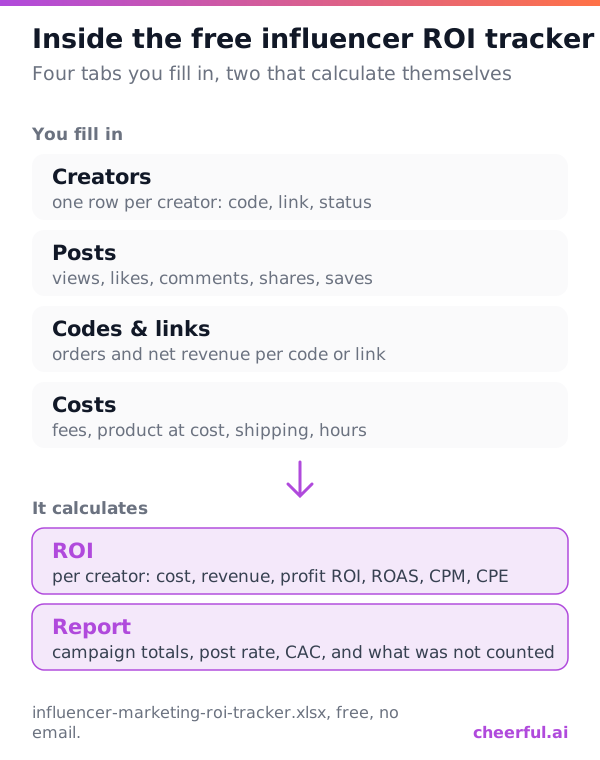
The tracker is an ungated .xlsx built around the method on this page. You fill in four tabs and two calculate themselves. Every total is a formula, so it keeps working after File, Import in Google Sheets.
| Tab | What goes in | What it gives you |
|---|---|---|
| Read me | Gross margin, team hourly cost, your paid-social CPM, attribution window | The inputs every formula uses |
| Creators | Handle, platform, followers, deal type, status, code, tracking link | The roster and the join key (handle) |
| Posts | Date, format, URL, views, likes, comments, shares, saves, clicks | Engagements, engagement rate per view, content value at your CPM |
| Codes & links | Orders, gross sales, discounts, refunds, new customers per code or link | Net attributed revenue |
| Costs | Fees, product at cost, shipping, hours, tools (per creator or CAMPAIGN) | Hours converted to dollars at your rate |
| ROI | Nothing: it reads the tabs above | Per creator: cost, revenue, gross profit, profit ROI, ROAS, CPM, CPE, cost per order |
| Report | Nothing | Campaign totals, post rate, cost per new customer, and a “not counted” line |
To keep the sheet honest, type each handle exactly the same way on every tab (the ROI tab matches rows on it), log product at cost rather than retail, and fill in the “what is not counted” line on the Report tab every time. If your roster already lives in a Google Sheet, Cheerful can sync creator status to it so the Creators tab stays current without retyping.
When should you use an influencer tracking tool instead of a spreadsheet?
Use the spreadsheet until the capture work stops getting done. Around ten creators at a time, checking profiles and copying numbers by hand is fine. Past that, three things usually break first: Stories are missed because nobody checked that day, codes are created by hand and some creators never get one, and view counts are copied once and never updated. When any of those happens, the sheet still totals correctly but the inputs are wrong.
Tracking tools solve different parts of that. Enterprise measurement suites such as Traackr and CreatorIQ are built around benchmarking and governance reporting for large programs. Discovery and management platforms such as Modash and HypeAuditor include post tracking alongside search. Cheerful detects posts and ties code sales to creators as part of running the campaign itself: outreach, replies, gifting orders and codes all happen in the same place, so the tracking inputs exist by default. None of these makes the ROI decision for you; they fill in the rows. (A use-case comparison is in best influencer marketing platforms.)
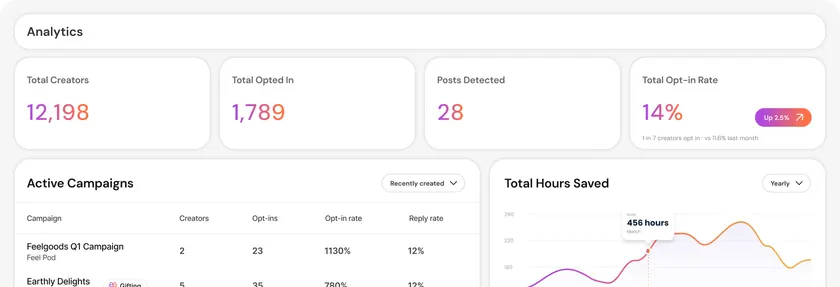
The analytics features page lists what Cheerful reports. If you are choosing between a tool and a spreadsheet more broadly, do you need an influencer marketing platform has the hour-by-hour arithmetic.
How do you report influencer ROI to your boss?
On one slide, in this order: what happened, what it cost, what it returned, and what you would change. The Report tab of the tracker is laid out that way.
- 1The funnel with denominators: creators contacted, agreed, shipped, posted. Spacegoods’ first tranche read 474 identified, 368 pitched, 216 engaged, 137 in conversation, 47 shipped.
- 2Total cost with the hours line visible, and cost per creator who posted.
- 3Attributed net revenue, gross profit and profit ROI, with the attribution window stated.
- 4Content value at your paid-social CPM, on its own line.
- 5The top five creators by profit, which is next campaign’s shortlist, and the bottom five, which is who not to rebook.
- 6What the method cannot see (halo sales, repeat purchases after the window) so nobody reads it as zero.
Keep campaigns comparable: the same window, the same margin and the same hourly rate every time. A 14% profit ROI is only meaningful next to last quarter’s number calculated the same way. For planning the next round, the influencer marketing strategy guide covers goals and budgets.
Frequently asked questions
- What is the average ROI for influencer marketing?
- There is no reliable average for sales ROI. The widely quoted $5.20 to $5.78 per $1 comes from Influencer Marketing Hub’s 2020 benchmark report, a self-reported survey of about 4,000 marketers, and it measured earned media value per dollar in 2018 and 2019, not revenue or profit. Calculate your own profit ROI and compare it with your other channels.
- What is a good ROI for influencer marketing?
- Any profit ROI above zero that beats your next-best channel on the same attribution. Start from your break-even ROAS, which is 1 divided by your gross margin: 1.54x at 65% margin, 3.33x at 30%. Revenue below that line loses money on the sales you can measure.
- How do you calculate influencer marketing ROI?
- Profit ROI = (gross profit from attributed sales minus total cost) divided by total cost. Total cost includes creator fees, product at cost, shipping, software and team hours. Example: $11,000 attributed revenue at 65% margin is $7,150 gross profit; against $6,290 of cost that is a 14% profit ROI.
- How do you track influencer marketing?
- Capture every post first (date, views, engagement, including Stories and untagged posts), then attribute sales with at least two methods: a unique discount code per creator and a UTM-tagged link. Add a post-purchase survey or a holdout test to size the sales codes miss.
- What KPIs should you track for influencer marketing?
- Match the KPI to the goal: views and CPM for awareness, engagement rate per view and CPE for engagement, clicks for traffic, attributed revenue and profit ROI for sales, cost per usable asset for content, and cost per opt-in for affiliate recruiting. Always add post rate: posts published as a share of creators shipped.
- What is the difference between ROI and ROAS in influencer marketing?
- ROAS is revenue divided by cost. ROI subtracts cost and, done properly, uses gross profit instead of revenue. A campaign with 1.75x ROAS can have only a 14% profit ROI once product cost is counted, so report which one you mean.
- Is EMV the same as ROI?
- No. Earned media value estimates what the reach would have cost as paid media, and there is no single standard formula for it. Report it beside ROI as content value, priced at your own paid-social CPM, and keep it out of the ROI numerator.
- What is the best influencer tracking platform?
- It depends on what breaks first. For enterprise benchmarking and governance, measurement suites such as Traackr and CreatorIQ are built for it. For small teams, the main need is capturing posts and code sales automatically; Cheerful does both as part of running the campaign. Under about ten creators, a spreadsheet like the free tracker is enough.
- What type of marketing has the highest ROI?
- There is no trustworthy cross-channel ranking, because channels are measured with different attribution. The only fair comparison is your own: calculate profit ROI for each channel with the same margin, cost lines and attribution window, then move budget toward the one that wins.